どうも、しゅん@Trade Techです。
僕のブログもそうですが、Webサイトではよく「テーブル形式(表形式)」で情報を見やすく表示している事が多いですよね。
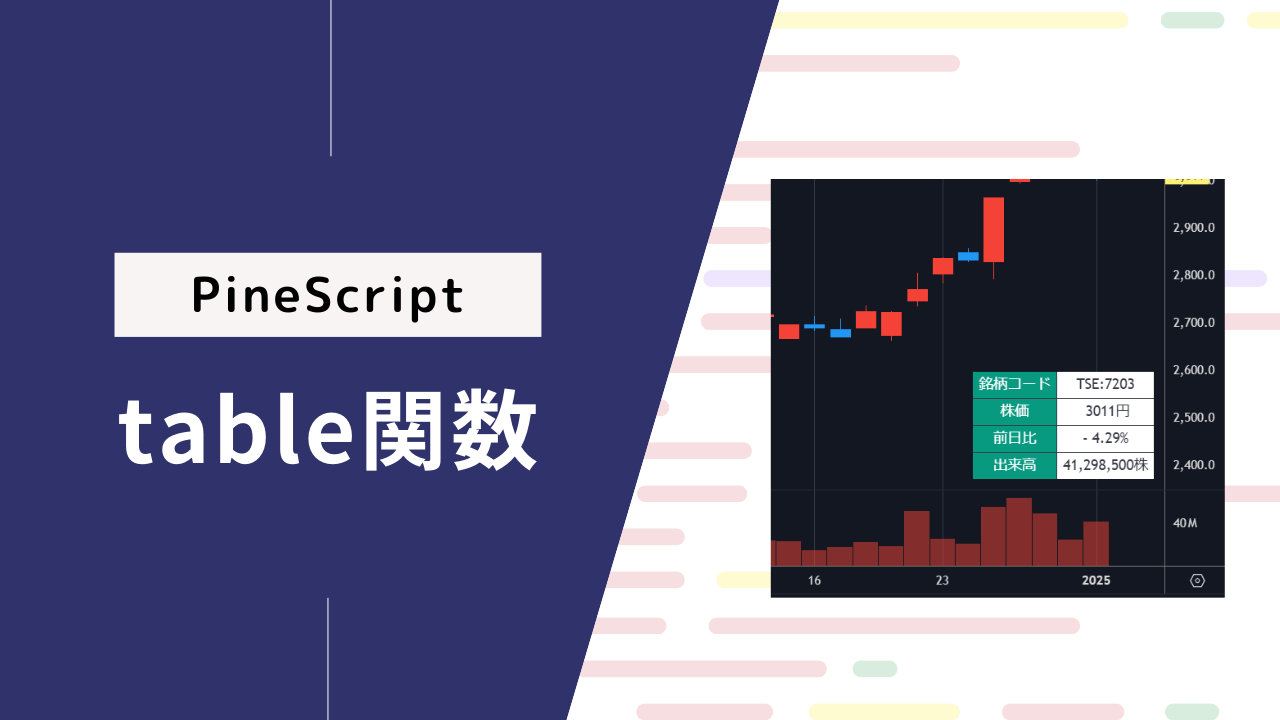
実はPineScriptでも、TradingViewのチャート上にもテーブル表示が出来ることをご存じですか?table関数というものを使うと以下のような表示が可能です。
文字やテキストの表示はlabel関数などでも可能ですが、table関数をマスターすれば上のようにより見やすい形式で様々な情報を表示させることができます。
本記事ではPineScriptでテーブル形式(表形式)の出力ができるtable関数の仕組みやパラメータについて解説します。
基本的なtable関数の使い方
table関数は、表形式の表示が出来る関数です。表形式なので行列の概念があり、最初に縦何行 x 横何列の表にするかを指定してから、各要素に表示させたい値を設定していきます。GoogleシートやExcelなどと同様に、1つ1つの要素は「セル(cell)」と呼ばれます。
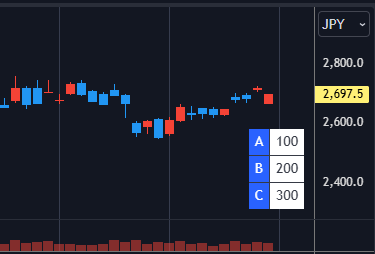
以下は、横2列 x 縦3行の表(テーブル)を用意し、1列目にA~Cの値を、2列目に100~300の値を、それぞれ設定するサンプルです。(1列目は見やすいように背景色を青にしています)
//@version=6
indicator("TTO_PineSample_table", overlay=true)

var status_table = table.new(position=position.bottom_right, rows=3, columns=2, bgcolor=color.white, border_width=1, border_color=color.black)

if barstate.islast
    table.cell(table_id=status_table, row=0, column=0, text="A", bgcolor=color.blue, text_color=color.white)
    table.cell(table_id=status_table, row=0, column=1, text="100")
    table.cell(table_id=status_table, row=1, column=0, text="B", bgcolor=color.blue, text_color=color.white)
    table.cell(table_id=status_table, row=1, column=1, text="200")
    table.cell(table_id=status_table, row=2, column=0, text="C", bgcolor=color.blue, text_color=color.white)
    table.cell(table_id=status_table, row=2, column=1, text="300")
コードの簡単な解説ですが、まず以下の部分で値の入っていない空の表(テーブル)を作成しています。
var status_table = table.new(position=position.bottom_right, rows=3, columns=2, bgcolor=color.white, border_color=color.black, border_width=1)table.newが表(テーブル)を作成する関数で、パラメータはそれぞれ以下の通りです。
position:表をどの位置に表示するか?(position.bottom_rightで「左下」)
rows:何行の表にするか?
columns:何列の表にするか?
bgcolor:表全体の背景色
border_color:表の罫線の色
border_width:表の罫線の太さ
なので今回の場合は、「チャートの左下に2列3行の表を描画、背景色は白で罫線は黒の太さ1」という意味になりますね。
次にlabelやlineの時と同様、barstate.islastを利用して、足の最後でのみ表内の値を設定しています。ifの中では以下のような記述がありますが・・
table.cell(table_id=status_table, row=0, column=0, text = "A", bgcolor=color.blue, text_color=color.white)table.cell関数が、「対象テーブルの●行●列にあるセルを設定する」という関数になります。今回利用しているパラメータは、以下の通り。
table_id:対象テーブルのID(table.newの戻り値)
row / column:何行何列目のセルか?
text:セルに表示したいテキスト
bgcolor:セルの背景色(テーブル全体の背景色よりも優先)
text_color:テキストの色
なので上の場合は、「0行0列のセルにテキストAを表示し、背景色は青、テキスト色は白にする」という意味になります。
・・と、こんな感じでtable関数は、最初にtable.newで何行何列のテーブルにするかを設定してから、table.cellで各セルの値を設定する、という使い方になります。
table関連の関数&パラメータまとめ
以下、テーブルの作成およびセルの設定などに関連する関数とパラメータについて、カテゴリー別にまとめました。
テーブル本体の作成と削除
テーブルの新規作成(table.new)
●行●列のテーブルを新規作成します。
table.new(position, columns, rows, frame_color, frame_width, bgcolor, border_color, border_width, force_overlay)パラメータのいくつかは先に紹介しましたが、改めてまとめます。
| position | 表をどの位置に表示するか? | 以下から選択: position.top_left(左上) position.top_center(上) position.top_right(右上) position.middle_left(左) position.middle_center(真ん中) position.middle_right(右) position.bottom_left(左下) position.bottom_center(下) position.bottom_right(右下) |
| columns | 何列の表にするか? | |
| rows | 何行の表にするか? | |
| bgcolor | 表全体の背景色 | |
| frame_color | 外枠の色 | |
| frame_width | 外枠の太さ | |
| border_color | 表の罫線の色 | |
| border_width | 表の罫線の太さ | |
| force_overlay | trueにすると、チャートと別のペインに設置した場合でもテーブルをチャート上に表示できます |
以下は、force_overlayを利用したサンプルです。終値グラフをチャートとは別のペインに表示しつつ、テーブルはチャート上に表示させています。
//@version=6
indicator("TTO_PineSample_table")

plot(close, color=color.green)

var status_table = table.new(position=position.bottom_right, rows=3, columns=2, bgcolor=color.white, border_color=color.black, border_width=1, force_overlay=true)

if barstate.islast
    table.cell(table_id=status_table, row=0, column=0, text="A", bgcolor=color.blue, text_color=color.white)
    table.cell(table_id=status_table, row=0, column=1, text="100")
    table.cell(table_id=status_table, row=1, column=0, text="B", bgcolor=color.blue, text_color=color.white)
    table.cell(table_id=status_table, row=1, column=1, text="200")
    table.cell(table_id=status_table, row=2, column=0, text="C", bgcolor=color.blue, text_color=color.white)
    table.cell(table_id=status_table, row=2, column=1, text="300")
テーブルの削除(table.delete)
こちらはあまり使わないかもしれませんが、一度作成したテーブルを削除したい場合はtable.deleteが使えます。
table.delete(table_id)var table1 = table.new ~ などでテーブルを作成した際に、table1変数にそのテーブルのIDが入るので、table.deleteのパラメータにそのIDを指定すれば削除できます。
テーブル本体の設定
table.newの後にテーブル全体の設定を再設定したい場合は、table.set_***関数が使えます。
以下のような関数が用意されており、それぞれ最初のパラメータに対象テーブルのIDを、その後に設定したい値を書く、という使い方になります。
| テーブルの位置を設定 | table.set_position(table_id, position) |
| テーブル全体の背景色を設定 | table.set_bgcolor(table_id, bgcolor) |
| テーブルの外枠の色を設定 | table.set_frame_color(table_id, frame_color) |
| テーブルの外枠の太さを設定 | table.set_frame_width(table_id, frame_width) |
| テーブルの罫線の色を設定 | table.set_border_color(table_id, border_color) |
| テーブルの罫線の太さを設定 | table.set_border_width(table_id, border_width) |
セルの設定
表内のセルを設定する場合は、table.cell関数が使えます。
table.cell(table_id, column, row, text, width, height, text_color, text_halign, text_valign, text_size, bgcolor, tooltip, text_font_family)各パラメータは以下の通りです。
| table_id | 対象テーブルのID | |
| column | 対象セルの列番号 | 0からカウント |
| row | 対象セルの行番号 | 0からカウント |
| text | セルに表示するテキスト | |
| width | セルの横幅 | %で指定 |
| height | セルの縦幅 | %で指定 |
| text_color | テキストの色 | |
| text_halign | テキストの水平方向寄せ | 以下から選択: text.align_left(左寄せ) text.align_center(中央寄せ) text.align_right(右寄せ) |
| text_valign | テキストの垂直方向寄せ | 以下から選択: text.align_top(上寄せ) text.align_center(中央寄せ) text.align_bottom(下寄せ) |
| text_size | テキストの大きさ | 以下から選択: size.auto(自動) size.tiny(かなり小さい) size.small(小さい) size.normal(普通) size.large(大きい) size.huge(かなり大きい) |
| bgcolor | セルの背景色 | |
| tooltip | ツールチップ | |
| text_font_family | テキストのフォント | 以下化r選択: font.family_default(通常) font.family_monospace(ものスペース) |
また、セルの特定のパラメータだけを設定したい場合は、table.cell_set_***関数が便利です。こちらは「テーブルID、列番号、行番号」が共通パラメータで、その後に設定したい値を書く、という使い方になります。
| 指定セルの幅を設定 | table.cell_set_width(table_id, column, row, width) |
| 指定セルの高さを設定 | table.cell_set_height(table_id, column, row, height) |
| 指定セルの背景色を設定 | table.cell_set_bgcolor(table_id, column, row, bgcolor) |
| 指定セルのテキストを設定 | table.cell_set_text(table_id, column, row, text) |
| 指定セルのテキストの色を設定 | table.cell_set_text_color(table_id, column, row, text_color) |
| 指定セルのテキストのサイズを設定 | table.cell_set_text_size(table_id, column, row, text, text_size) |
| 指定セルのテキストのフォントを設定 | table.cell_set_text_font_family(table_id, column, row, text_font_family) |
| 指定セルのテキストの水平方向の寄せ方を設定 | table.cell_set_text_halign(table_id, column, row, text_halign) |
| 指定セルのテキストの垂直方向の寄せ方を設定 | table.cell_set_text_valign(table_id, column, row, text_valign) |
| 指定セルにマウスを当てた時に表示されるツールチップを設定 | table.cell_set_tooltip(table_id, column, row, tooltip) |
セルの操作(削除と結合)
特定のセルまたはセル範囲を削除(クリア)したい場合は、table.clear関数が使えます。
table.clear(table_id, start_column, start_row, end_column, end_row)また特定のセル範囲を結合(マージ)したい場合は、table.merge_cells関数が使えます。
table.merge_cells(table_id, start_column, start_row, end_column, end_row)いずれもパラメータは以下の通り。
| table_id | 対象のテーブルID |
| start_column | 削除(結合)したいセル範囲の開始列番号 |
| start_row | 削除(結合)したいセル範囲の開始行番号 |
| end_column | 削除(結合)したいセル範囲の終了列番号 |
| end_row | 削除(結合)したいセル範囲の終了行番号 |
配列関連
こちらは上級者向けですが、複数のテーブルを扱う場合は配列との組み合わせが便利です。
テーブル形式の配列を作りたい場合はarray.new_table()が、現在インジケーターがチャートに描画している全テーブルを配列として取得するにはtable.allが、それぞれ使えます。
リアルタイム情報をテーブル表示
テーブルが一番便利なのは、リアルタイムの情報を表示する時かなと思います。ラベルなどでも出来るのですが、テーブルだと項目名とその値をセットで表示できるので、とても見やすい情報表示領域を自作できます。
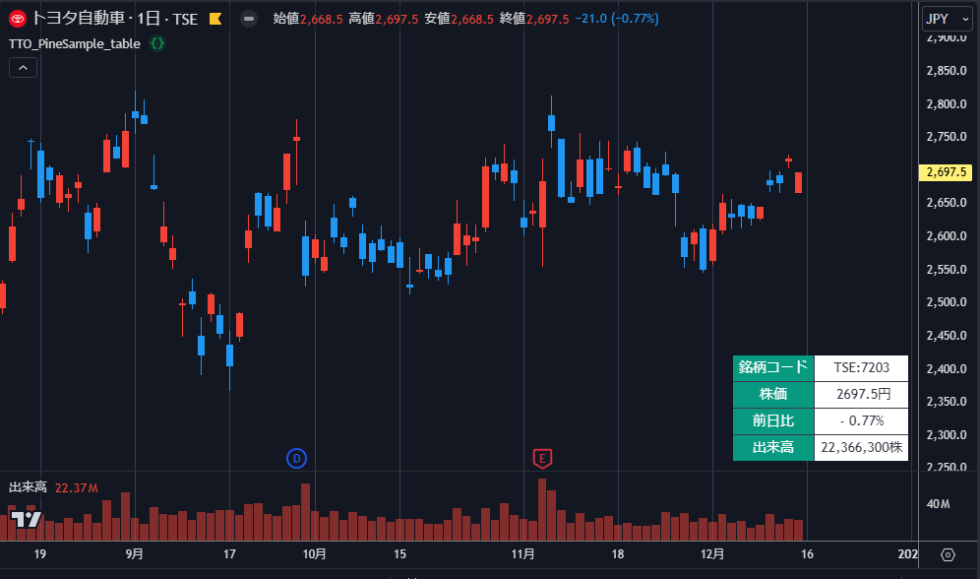
以下は現在表示しているチャートの「銘柄コード」「株価(現在値)」「前日比」「出来高」をテーブル表示したものです。項目名や値を変えれば様々な表示ができるので、試してみてください。
//@version=6
indicator("TTO_PineSample_table", overlay=true)

var status_table = table.new(position=position.bottom_right, columns=2, rows=4, bgcolor=color.white, border_width=1, border_color=color.black)
if barstate.islast
    table.cell(table_id=status_table, row=0, column=0, text = "銘柄コード", bgcolor=color.teal, text_color=color.white)
    table.cell(table_id=status_table, row=0, column=1, text = syminfo.tickerid)
    table.cell(table_id=status_table, row=1, column=0, text = "株価", bgcolor=color.teal, text_color=color.white)
    table.cell(table_id=status_table, row=1, column=1, text = str.format("{0,number, #.#}円", close))
    table.cell(table_id=status_table, row=2, column=0, text = "前日比", bgcolor=color.teal, text_color=color.white)
    table.cell(table_id=status_table, row=2, column=1, text = str.format("{0,number, #.##}%", (close / close[1] - 1) * 100))
    table.cell(table_id=status_table, row=3, column=0, text = "出来高", bgcolor=color.teal, text_color=color.white)
    table.cell(table_id=status_table, row=3, column=1, text = str.format("{0,number}株", volume))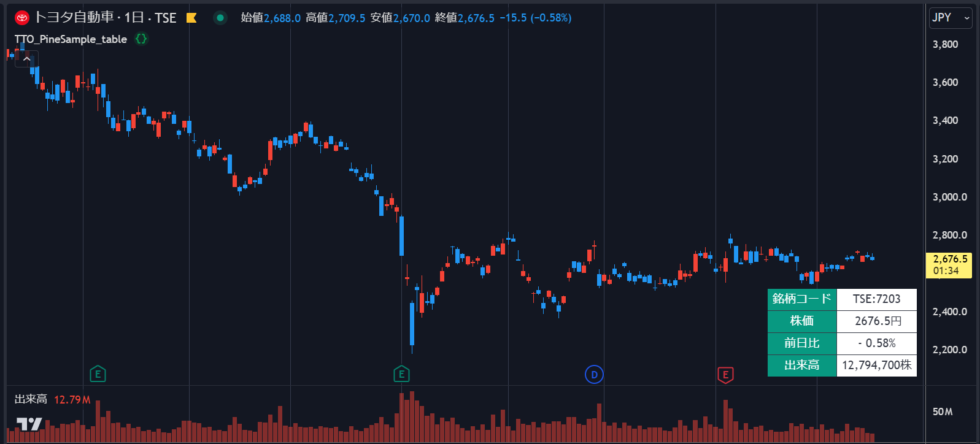
おわりに
以上、table関数の基本的な仕組みと、表示スタイルやパラメータの一覧をまとめてご紹介しました。
ぜひサンプルコードを参考にして、ボックスエリアの表示にチャレンジしてみてください。