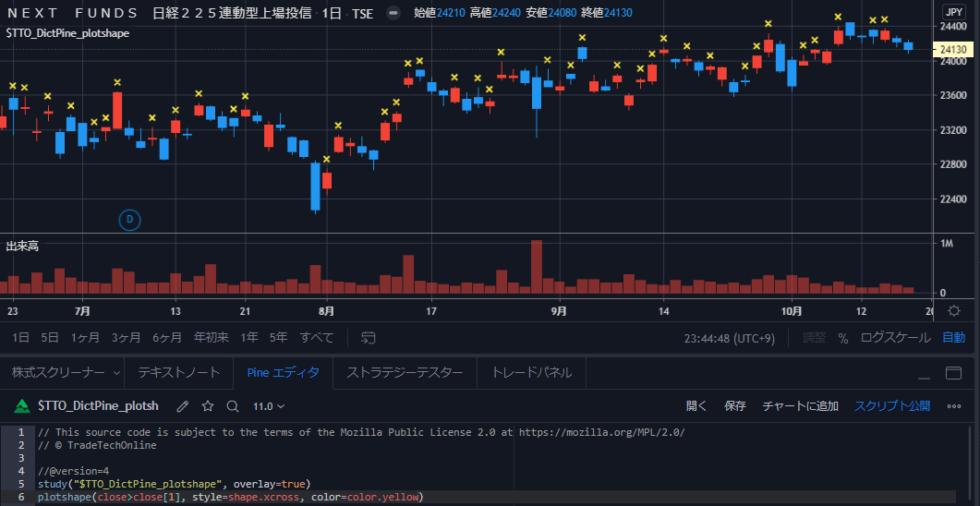
plotshape
定義
plotshape(series, title, style, location, color, transp, offset, text, textcolor, editable, size, show_last, display)
引数
| 引数名 | 内容 | 初期値 |
|---|---|---|
| series | 【location.absolute以外の時】 本引数に設定した式がtrueの時だけ、図形(マーク)を描画 【location.absoluteの時】 本引数に指定した価格に図形(マーク)を描画 |
(必須) |
| title | プロットのタイトル | |
| style | 図形(マーク)の種類 shape.cross:+マーク shape.xcross:xマーク shape.circle:丸マーク shape.triangleup:上三角マーク shape.triangledown:下三角マーク shape.square:四角マーク shape.diamond:ダイヤモンドマーク shape.flag:旗マーク shape.arrowup:上矢印 shape.arrowdown:下矢印 shape.labelup:上吹き出しラベル shape.labeldown:下吹き出しラベル |
shape.xcross |
| location | 図形(マーク)の描画位置 location.abovebar:足のすぐ上 location.belowbar:足のすぐ下 location.top:チャート上端(固定) location.bottom:チャート下端(固定) location.absolute:絶対座標 |
location.abovebar |
| size | 図形のサイズ size.auto:自動 size.tiny:極小サイズ size.small:小サイズ size.normal:通常サイズ size.large:大サイズ size.huge:極大サイズ |
size.auto |
| color | 図形(マーク)の色 | |
| transp | 図形(マーク)の透明度。0~100で指定 0:不透明 100:完全透明(非表示) |
0 |
| offset | 指定した本数だけグラフを左または右に移動します。 | 0 |
| text | 図形(マーク)に添えるテキスト(\nで改行可) | |
| textcolor | 図形(マーク)に添えるテキストの色 | |
| editable | プロットされたグラフを設定画面から設定変更可能かどうか指定します。 | true |
| show_last | 数値を指定すると、すべてのグラフではなく最終N足分のグラフのみを表示します。 | (無し) |
| display | プロットしたグラフを表示するかどうか指定できます。 display.all:表示する display.none:表示しない |
display.all |
戻り値
(無し)
サンプルコード
終値が前日より上昇した足に黄色いxマークを描画
plotshape(close>close[1], style=shape.xcross, color=color.yellow)
300円以上の値幅がある陽線に「大陽線」を、
300円以上の値幅がある陰線に「大陰線」を、それぞれラベル表示
plotshape(high - low >= 300 and close > open, style=shape.labeldown, color=color.orange, location=location.abovebar, text='大陽線', textcolor=color.white)

plotshape(high - low >= 300 and close < open, style=shape.labelup, color=color.aqua, location=location.belowbar, text='大陰線', textcolor=color.white)
ダイアモンド型のマークを23,000円の価格に横一線で表示
plotshape(23000, style=shape.diamond, color=color.lime, location=location.absolute)
Warning: Undefined array key 0 in /home/tradetech1/tradetech.online/public_html/wp-content/themes/swell/classes/Utility/Get.php on line 805

